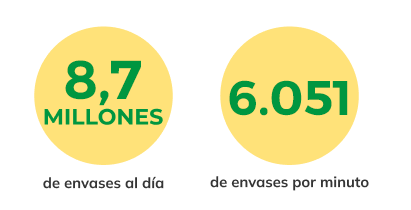
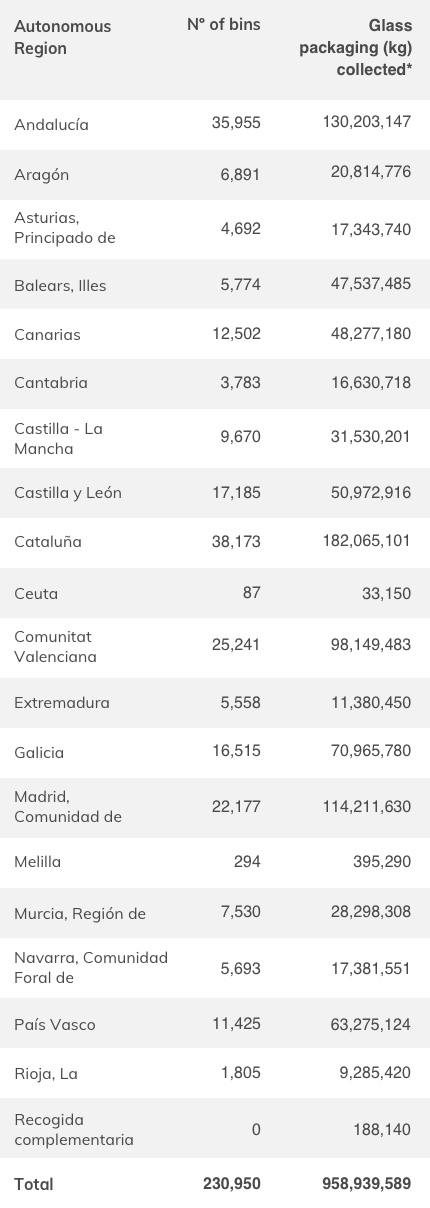
* The data per autonomous region includes the selective collection made through green bins and urban waste plants. The province and municipality data only includes the selective collection made through green bins.
* This column shows the total kg of glass container waste. This is the selective collection through the green container added to the collection through urban waste plants.
Travel through our interactive map and learn about the volume of glass packaging waste collected in your province. Will it be below or above average? Click on the province and clear up your doubts.
Did you know that glass is made up of natural raw materials and that it is inert? Learn about all its properties!
Recycling glass packaging is something within everyone's reach. It costs very little and, in return, the environmental benefits are countless. Don't you know them yet?

